
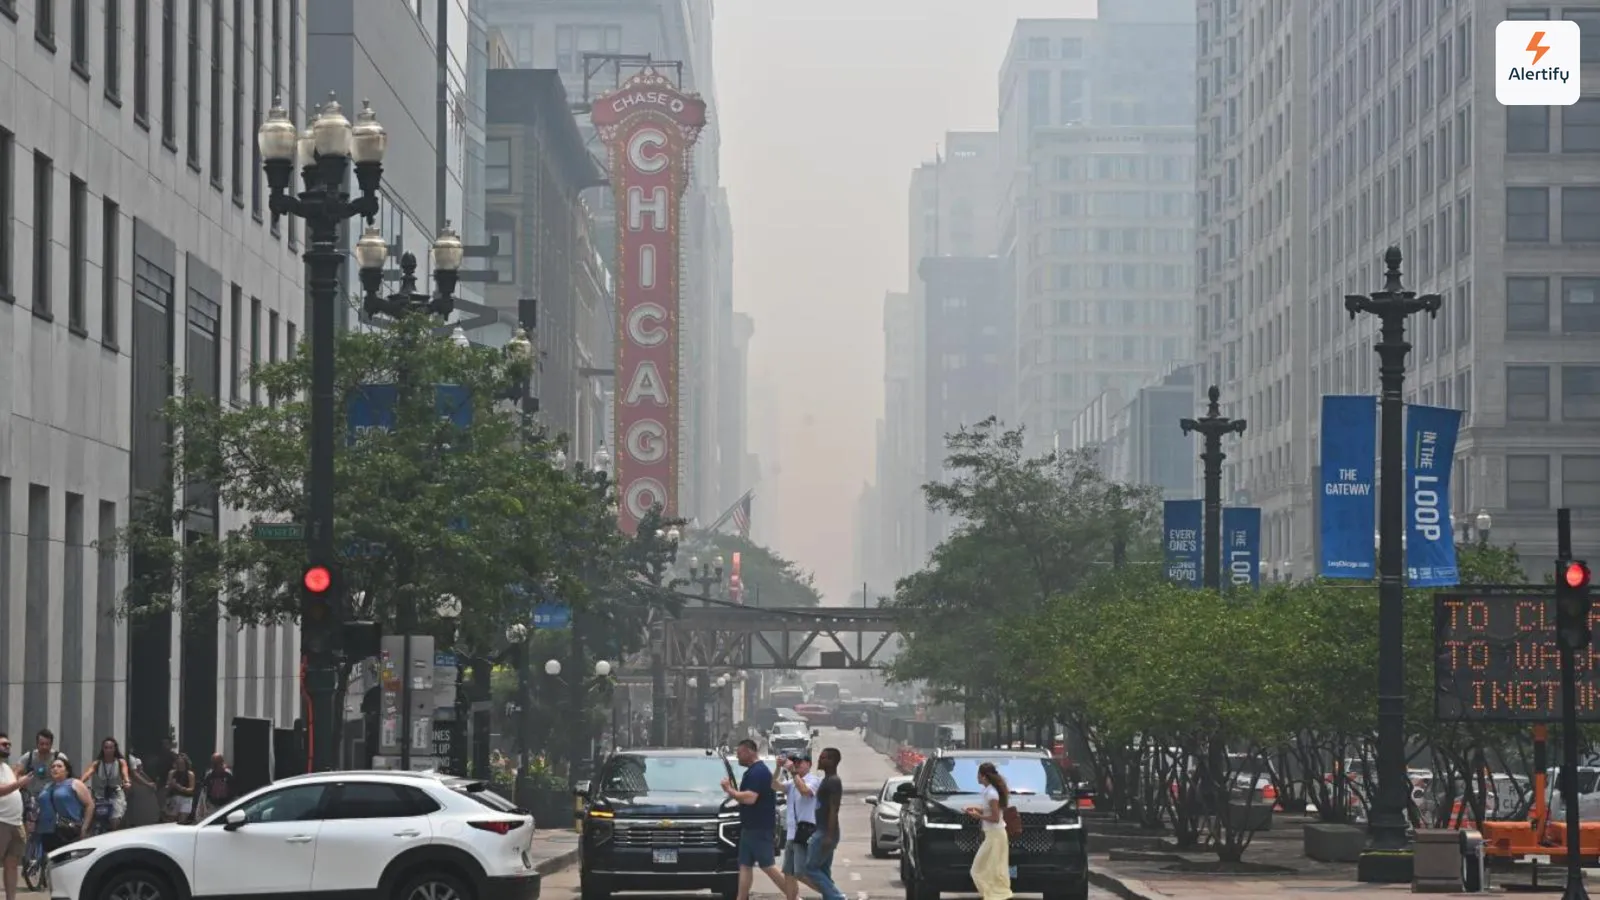
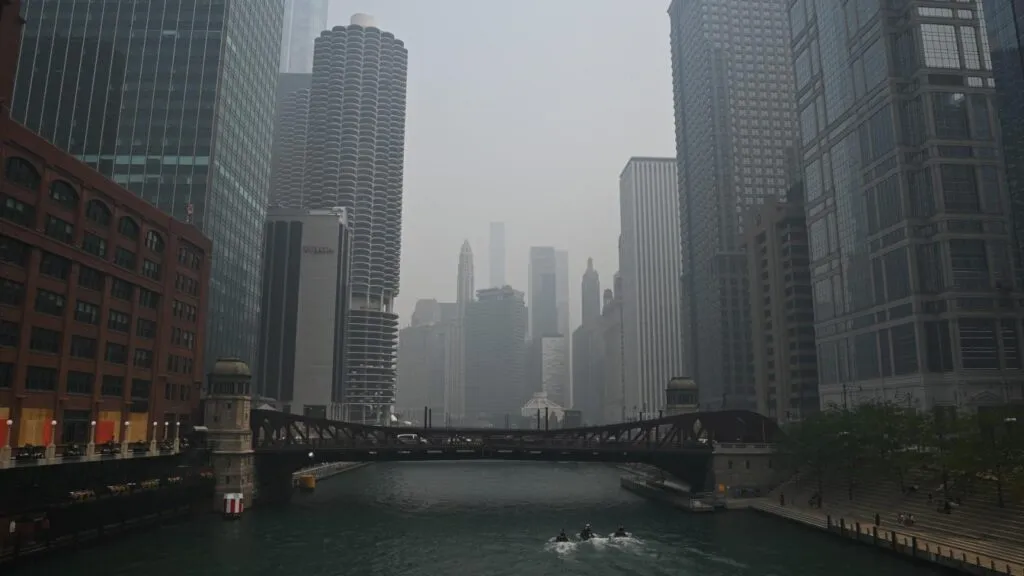
For the better part of a week, Chicago has been cycling through some of the worst air on the planet. It began on July 16, when a thick brown haze settled over the skyline, beaches and pools shut down, and residents were told to stay inside. The smoke eased, then rolled back in over the weekend. But “stay inside” carries a quiet assumption: that the air indoors is safe. This is exactly where indoor air quality monitoring matters, and where the numbers coming off connected sensors in real Chicago apartments tell a story a glance out the window never could. In some of those buildings, Alertify devices were logging what was actually happening inside people’s homes as the smoke rolled through.
What’s Been Happening in Chicago
The smoke did not start in Chicago. It started hundreds of miles north. Lightning strikes touched off more than a dozen active wildfires across Canada and Minnesota’s Boundary Waters Canoe Area Wilderness, and prevailing winds carried the plume south across the Great Lakes into northern Illinois, according to WTTW News. The U.S. Forest Service pointed to a familiar combination of drought, heat, and high winds, with acres of dead balsam fir adding fuel like dry kindling.
The result reached Chicago fast. The Illinois Environmental Protection Agency declared an Air Pollution Action Day, the Chicago Park District closed all outdoor beaches and pools, and city officials urged people, especially children, older adults, pregnant women, and anyone with respiratory conditions, to limit time outside. By Thursday night the haze carried a strong campfire smell across neighborhoods from the Loop to the West Side.
The relief did not last. Conditions improved on Friday afternoon as southwestern winds pushed the plume out over Lake Michigan, and Saturday dipped back toward the moderate range. Then the smoke returned Saturday night, pulling Chicago back among the most polluted cities in the world and prompting fresh Air Pollution Action Days for Sunday and Monday. As of Monday, July 20, an air quality alert remains in effect through the evening, with a wind shift and possible storms that may finally clear the air. Forecasters caution that as long as the fires keep burning up north, the smoke can keep drifting back. For property owners and residents, that unpredictability is the hard part. You cannot plan around smoke you cannot measure.
Reading the Numbers: AQI and PM2.5 Explained
When news anchors say the air is “hazardous,” they usually mean the Air Quality Index, or AQI. It helps to know what that number represents before looking at how high it climbed.
What the Air Quality Index Measures
The AQI is a standardized scale that translates pollution concentrations into a single number and a color-coded category. In the United States, the Environmental Protection Agency runs the version you hear on the news: a 0 to 500 scale split into six bands climbing from Good through Moderate, Unhealthy, Very Unhealthy, and finally Hazardous. The higher the number, the more the air is likely to harm you, and the broader the group affected.
Air quality sensors built for indoor spaces use the same idea, translated into plain language. Alertify’s dashboard, for example, sorts each live reading into one of six categories, each with its own color:
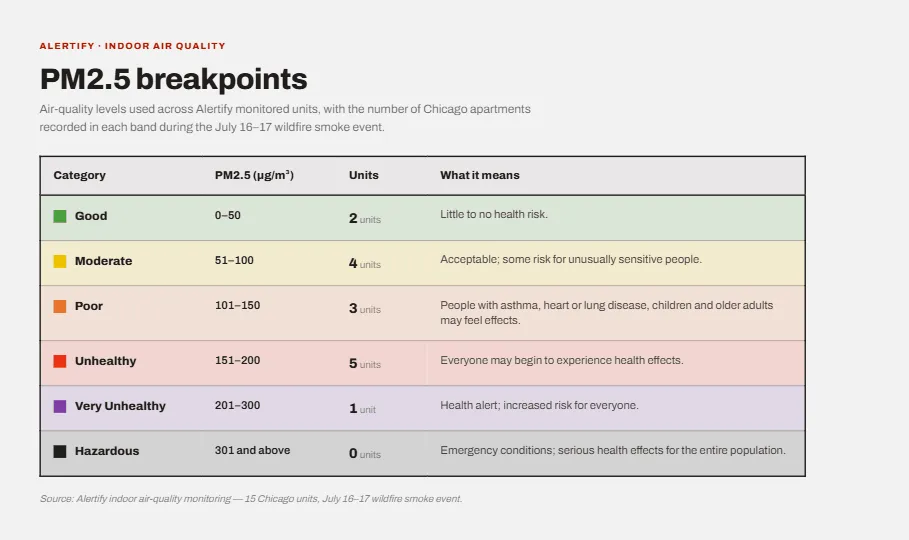
That table lays out what each band actually means for the people inside, from little to no risk at Good up to emergency conditions at Hazardous.
That color shift, green to yellow to orange and beyond, is the quickest way to read a room at a glance, and it is the scale the rest of this post is built on.
Why PM2.5 Is the Number That Matters
The pollutant driving Chicago’s crisis is PM2.5, fine particulate matter measuring 2.5 micrometers or smaller. These particles are the main health concern in wildfire smoke because of their size. As the National Weather Service explained, PM2.5 can cause an immediate burning sensation in the eyes and nose, but the real danger runs deeper: the particles settle far into the lungs and can cross into the bloodstream, as reported by The Spokesman-Review. Longer term, researchers have linked wildfire PM2.5 exposure to serious cardiac, respiratory, and even cognitive risk.
The practical takeaway is simple. When people talk about air quality during a smoke event, they are almost always talking about PM2.5. It is the number worth watching, and it is measured in micrograms per cubic meter of air. The table below maps those micrograms to the standard categories, from the “Good” ceiling of 50 up to the “Hazardous” line at 301.
How Bad Was It Compared to a Normal Chicago Day
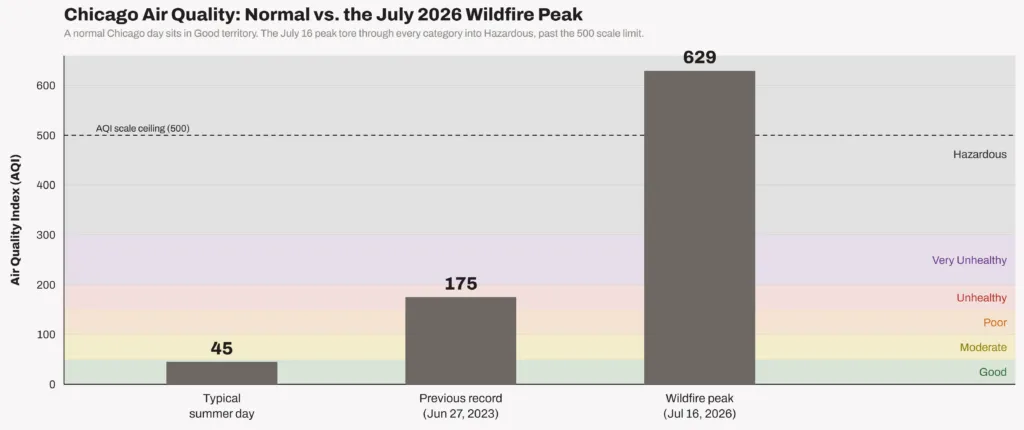
On a typical summer day, Chicago’s air sits comfortably in the Good to Low Moderate range, often an AQI in the 40s or 50s. Even the city’s worst historical reading was modest by comparison. The previous record was around 175, set on June 27, 2023, during an earlier round of Canadian wildfire smoke, according to FOX 32 Chicago.
This week blew past that. By around noon on July 16, the AQI had climbed to 366, deep into the hazardous range and likely the worst air quality ever recorded in the city. Some northern suburbs saw readings above 600. Chicago’s air briefly became the worst of any major city in the world, with composite readings near 629, as tracked by NBC Chicago. Federal monitors recorded a peak of 638 on a scale that officially tops out at 500, per Block Club Chicago.
That’s roughly ten to fifteen times worse than a normal Chicago summer day, and more than triple the city’s previous all-time high.
Why Closing Windows and Running the HVAC Isn’t Enough
The instinct during a smoke event is reasonable: shut the windows, run the air conditioning, and wait it out. That advice is only partly effective, and in dense cities full of older multifamily buildings, it can fall well short.
The Window Myth
Closing your windows helps, but it does not seal out smoke. Even with doors and windows shut and no air cleaner running, indoor PM2.5 typically settles at around 55 to 60 percent of outdoor levels, ranging anywhere from 30 to 100 percent depending on the building, according to the U.S. EPA. Leave a window open and indoor and outdoor levels become nearly identical. So on a day when the outdoor AQI hits 366, a “closed up” apartment could still be sitting at Very Unhealthy levels inside.
The reason is that homes are not airtight. PM2.5 is small enough to slip through gaps around window frames, door thresholds, electrical outlets on exterior walls, recessed lighting, and plumbing penetrations. Older buildings, which describe a large share of Chicago’s housing stock, tend to leak more than newer, tightly sealed construction.
When Your HVAC Becomes a Smoke Intake
Central heating and cooling can make things worse, not better. Many systems include a fresh-air or ventilation mode that periodically pulls outdoor air into the building. During a smoke event, that feature works directly against you, becoming, in effect, a smoke intake, as explained by indoor air specialists at Apex Clean Air.
Filtration is the other gap. The most common HVAC filters carry a MERV rating of 8 to 10, not fine enough to capture the smallest smoke particles. The EPA recommends a MERV 13 filter as a minimum for households worried about wildfire smoke. Without that upgrade, and with the system recirculating rather than drawing in fresh air, a standard setup just pushes smoky air around the room.
This matters most in high-density housing. In a large apartment block, dozens of units share walls, ductwork, and stairwells. Envelopes vary floor to floor, some units sit above ground-level intakes, and residents open doors and windows at different times. Two apartments in the same building can experience very different air on the same afternoon, and the only way to know which is which is to measure each space directly.
What the Air Inside One Chicago Apartment Block Looked Like
This is where measured data becomes far more useful than a citywide forecast. Alertify tracked indoor PM2.5 continuously across 15 monitored Chicago units through the smoke event, and the gap from one apartment to the next was wide enough to tell its own story.
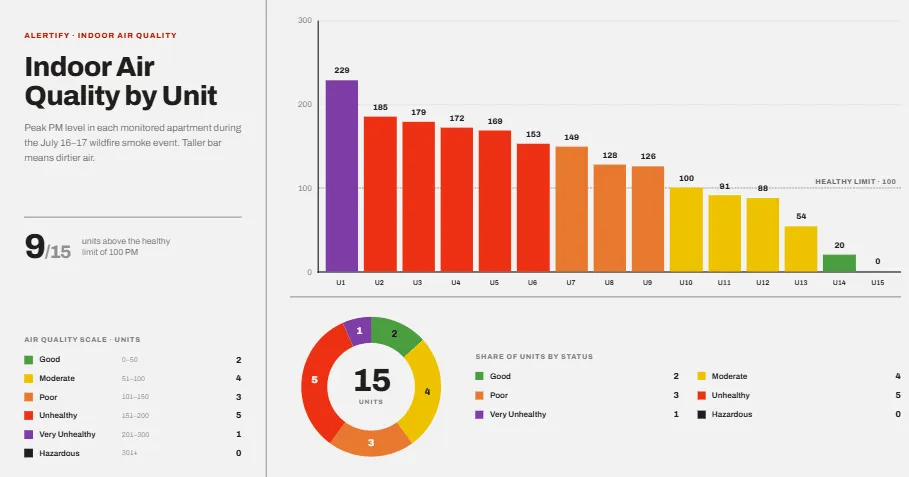
That single graphic is the whole event at a glance: each bar is one apartment’s peak PM2.5 reading, sorted from worst to best, and the donut beside it turns the same 15 units into a status breakdown. Nine of the fifteen crossed the healthy limit of 100 by the time the smoke passed through.
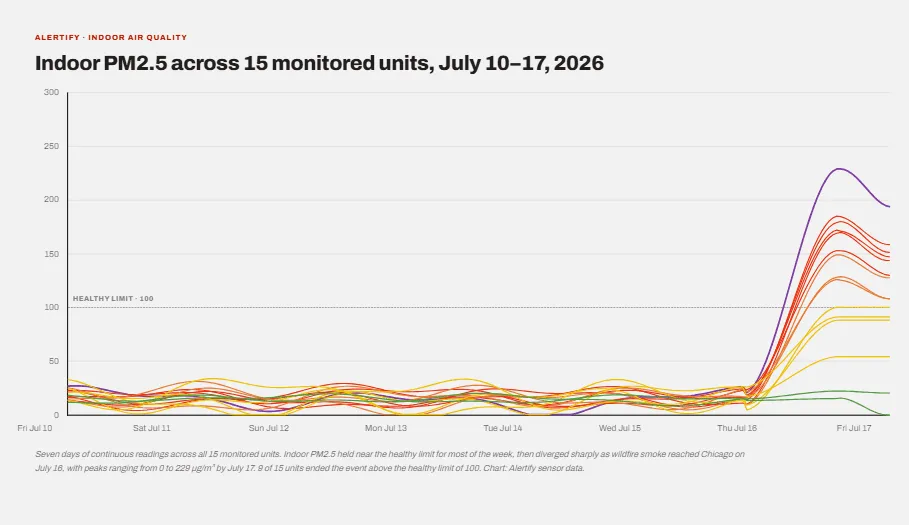
That chart is the whole portfolio for one week. Every line sits near the healthy limit of 100 µg/m³ through the calm days, then the lines fan apart starting Thursday, July 16, as the smoke reaches Chicago: some units barely move, others climb past 200 within hours.
The worst-hit apartment, Unit U1, was vacant, with no one managing the air. Close behind it, a cluster of units, both vacant and occupied, sat in the Unhealthy band with PM readings from roughly 153 to 185. Several more registered Poor, from 126 to 149. These are indoor readings, taken inside closed apartments, and they track closely with what the smoke was doing outside.
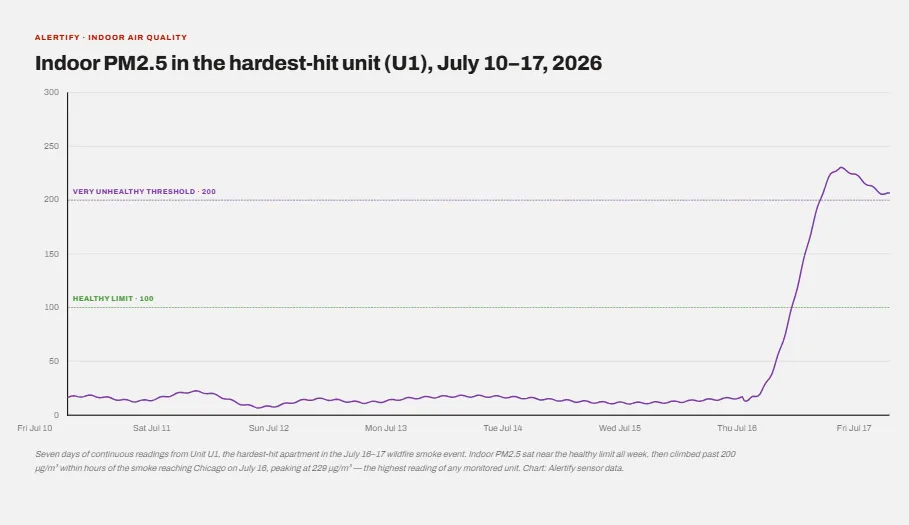
Zooming into Unit U1 alone shows the sharpest version of that climb: near the healthy limit all week, then across the Very Unhealthy threshold of 200 µg/m³ within hours of the smoke arriving, peaking at 229, the highest reading of any monitored unit.
Not every unit suffered equally. Some occupied apartments held in the Moderate range, around 88 to 100, and a handful stayed comfortably Good. One unit, U15, never left the healthy range. Same city, same smoke, and a spread that ran from a healthy baseline to Very Unhealthy inside a single portfolio. Whether the cleaner units had tighter seals, better filtration, or a purifier running in the corner, the data does not say on its own. But it proves the point: indoor air is not a single citywide number. It is a per-space reality, and it can be managed.
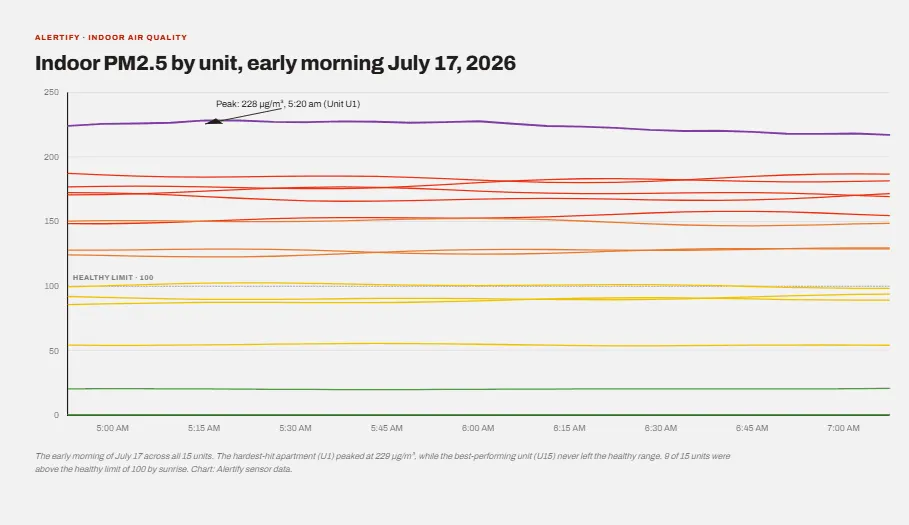
Zooming into the early hours of July 17 shows the gap held rather than closed. Unit U1 stayed near its peak of 229 through sunrise, while Unit U15 never left the healthy range, and the other 13 units settled between the two.
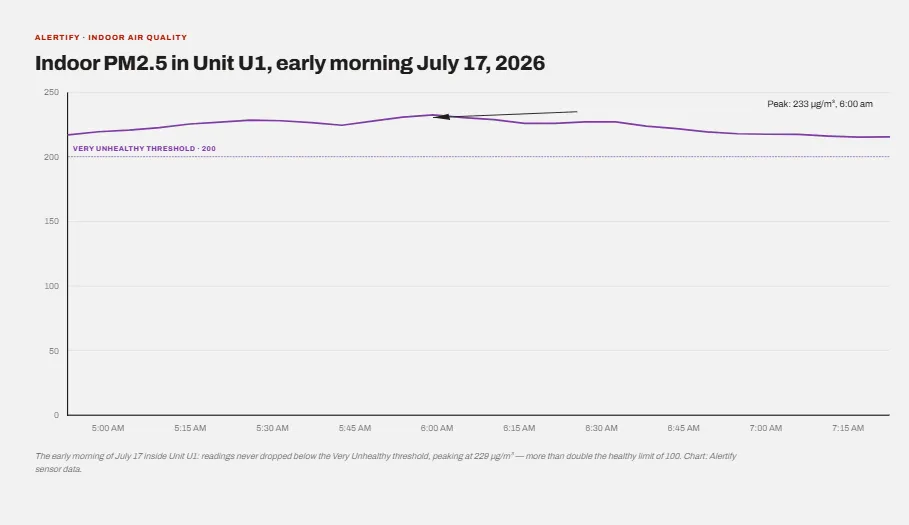
Inside Unit U1, readings never dropped below the Very Unhealthy threshold, more than double the healthy limit of 100. Because readings update continuously rather than as a single snapshot, you can watch a unit’s PM level climb and cross from one category into the next in exactly this kind of detail. As the outdoor smoke thickened, indoor particulates rose with it, tipping several apartments from Poor into Unhealthy and, at the worst, into Very Unhealthy. You see the air degrade as it happens, rather than after someone notices the haze.
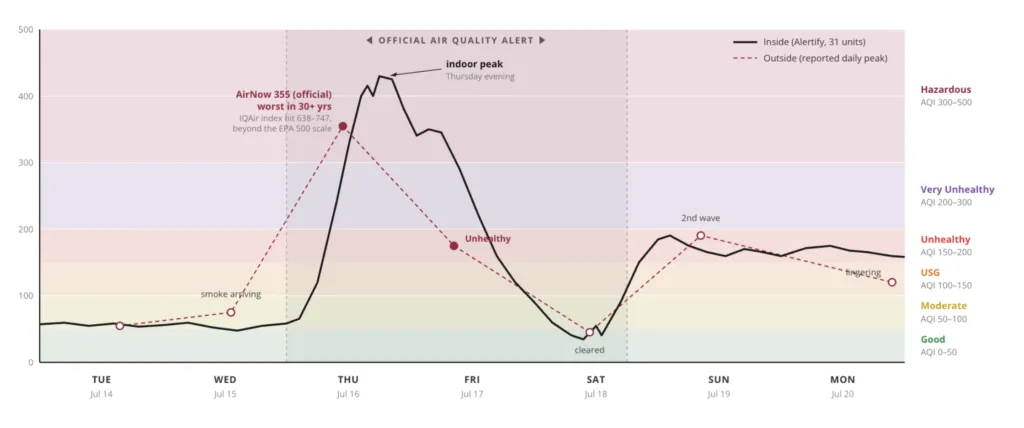
In a separate analysis of 31 properties, Alertify collected continuous indoor readings through the same July smoke event and compared them against Chicago’s outdoor air quality. The result is the clearest picture yet of how outdoor smoke translates into indoor exposure.
The chart plots two lines on the same 0–500 EPA scale. The dashed line is the outdoor air quality index, reported as daily peaks. The solid line is indoor air, computed from measured PM2.5 in the median apartment and converted to US AQI using the EPA formula. The shaded band marks the official air quality alert window.
For the first two days, both lines sit low and close together. Indoor air holds in the Moderate range while the city stays calm. Then the smoke arrives midweek, and the two lines climb almost in lockstep. Outdoor air spikes to an AirNow reading of 355 on Thursday, July 16, the worst in more than 30 years, with IQAir’s separate index climbing past the EPA’s 500-point ceiling to somewhere between 638 and 747. Indoor air followed within hours, and the median apartment peaked Thursday evening deep in the Hazardous band.
What stands out is how closely inside tracked outside. As the outdoor peak passed and the alert lifted, indoor readings fell too, dropping back toward the healthy range by Saturday when the outdoor air briefly cleared. Then a second wave pushed both lines back up on Sunday before they settled into a lingering Unhealthy-to-USG plateau through Monday.
The takeaway is simple. Outdoor smoke does not stay outdoors. Across 31 properties, indoor air rose and fell with the conditions outside, spending days well above the healthy limit even with doors and windows shut. Without continuous indoor monitoring, none of that exposure would have been visible until someone smelled the smoke or felt it.
How the Air Quality Monitoring Actually Works
The sensors behind these readings track particulate matter continuously and translate it into the same plain-language categories shown on the dashboard: Good, Moderate, Poor, Unhealthy, and up. Alongside the category sits the raw PM number, which is what lets you compare one unit to another or watch a single space change hour by hour. Alertify’s indoor air quality monitoring is the feature logging this data across the buildings above, and reading it is straightforward. A rising PM value and a shift from green to orange or red is your cue that the air in that specific room has degraded, regardless of what the forecast for the whole city says.
What This Data Tells Us, and How to Use It
A citywide AQI is a headline. Room-level data is a decision. The difference matters most when the two disagree, and this week they often did.
For anyone responsible for a space where people sleep, work, or recover, the practical value is timing. Continuous readings show the moment air quality starts to slip: switch the HVAC to recirculate, close off a leaky room, run a purifier, or in a rental, check on a guest before they check on you with a complaint. Waiting for visible haze indoors is waiting too long, because by the time smoke is visible, particle levels are already very high.
The unit-by-unit variability is the other lesson. If one apartment reads Good and the one above it reads Very Unhealthy, that is not noise, it is information about the building: where the leaks are, which units need better filtration, and which residents need attention first. Consistent data also creates a record, so decisions can be made on measurements rather than guesswork.
None of this replaces the basics. Close the windows, upgrade to a MERV 13 filter, run a clean air source, and follow local guidance to stay indoors when the AQI is hazardous. Measurement simply tells you whether any of it is working, and where it is not.
Clearer Air Starts With Knowing
Chicago’s smoke keeps clearing and rolling back in, and as long as the fires burn up north, it will likely keep doing that. What the past week made obvious is that “just stay inside” only holds up when you can see what the inside air is actually doing. A forecast covers a whole city. A sensor covers the room you are standing in, and those two numbers were far apart across Chicago apartments on July 16.
That gap is the real lesson. Whether it comes from a dedicated monitor, an air quality app, or connected sensors like the ones logging the readings above, having a live view of the air in a specific room turns an invisible problem into something you can see, measure, and respond to before it gets worse.
A smoke event makes the case loudly, but the same instrumentation earns its keep on ordinary days, when the problem is PM2.5 from a source inside the building rather than a plume from three states away. For anyone renting a property out, our guide to indoor air quality monitoring for vacation rentals covers what to watch and why, and the financial case for air quality monitoring works through what the data is actually worth once it exists.